Retirement guide
Investment Returns Risk During Retirement
Average returns do not tell the whole retirement story. When a portfolio is funding withdrawals, losses near the beginning of retirement can have a different effect from identical losses that arrive later. This guide explains that timing risk and the limits of a calculator built with steady annual returns.

Investment returns risk: a quick answer
Investment returns can vary substantially from year to year. When the order of gains and losses changes the result of a portfolio with cash flowing in or out, the timing effect is commonly called sequence-of-returns risk. During retirement, withdrawals after an early loss reduce an already smaller balance, leaving fewer assets to benefit if markets later recover.
Reversing the same returns does not change their arithmetic or geometric average. But it can change the ending balance after withdrawals. That is why one steady average return cannot show every path a retirement portfolio may take.
Average return is not a retirement outcome
A return assumption is useful for a planning baseline. It does not describe when gains and losses occur, how withdrawals interact with them, or whether the portfolio can recover from an early decline.
Why return order matters after withdrawals begin
If no money enters or leaves a portfolio, multiplying the same annual returns produces the same ending value regardless of order. In the illustration below, both sequences grow $1,000,000 to $1,241,063 when there are no withdrawals.
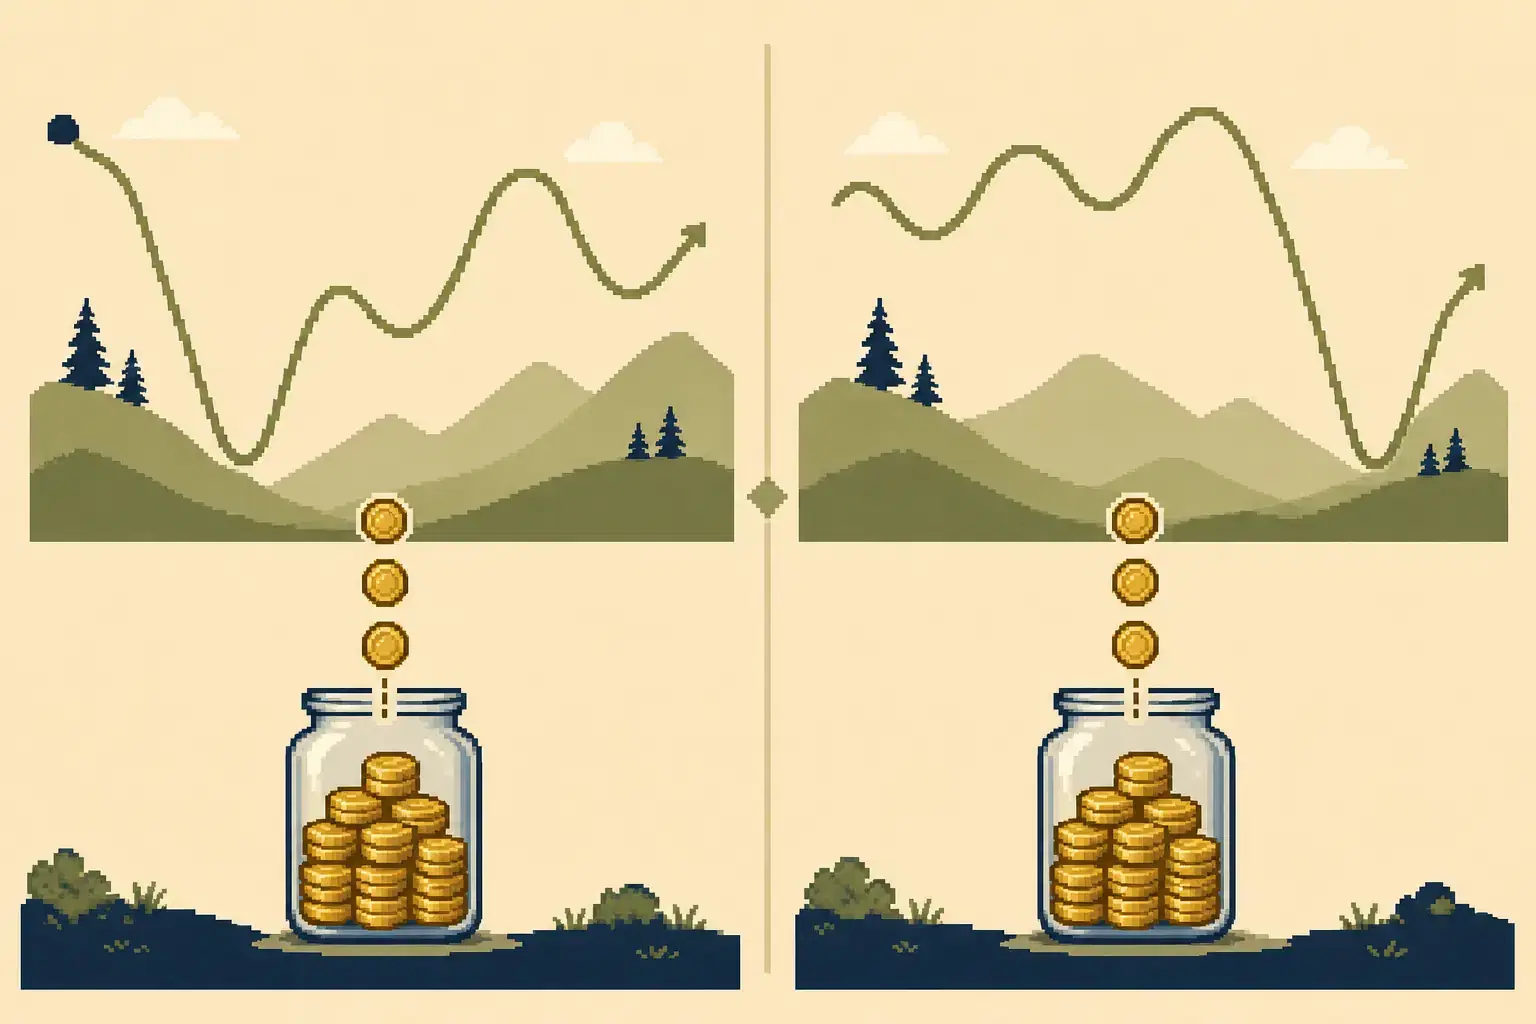
Withdrawals break that symmetry. A loss applies to the balance available that year, and the subsequent withdrawal reduces it again. Later positive returns then compound from a smaller base. If the losses arrive after years of growth, the portfolio may absorb the same percentage declines from a larger balance.
This is one reason FINRA emphasizes both portfolio risk and withdrawal management when discussing retirement income.
Illustration: an early loss versus a late loss
Both illustrative portfolios start with $1,000,000. Each takes a $50,000 withdrawal after the first year's return, and that withdrawal rises by 2.5% each year. Both receive one -20% loss and nine 5% gains. The return set has a 2.5%arithmetic average and a 2.2% geometric average in either order.
| Scenario | Loss occurs | Other nine annual returns | Ten-year ending balance | Difference from early-loss case |
|---|---|---|---|---|
| Early-loss return | Year 1 | +5% each year | $543,442 | Baseline |
| Late-loss return | Year 10 | +5% each year | $694,675 | $151,233 more |
The example is deliberately simplified. It excludes taxes, fees, asset allocation changes, and outside income. Its purpose is only to isolate the effect of return order when withdrawals occur; it is not a forecast or a recommended portfolio.
What can we do to address investment returns risk?
No single response removes sequence risk, and the appropriate mix depends on household needs, taxes, time horizon, income sources, and willingness to accept investment risk. Planning questions to address investment fluctuations include:
- Whether essential spending is covered partly by income that does not require selling assets from a portfolio that has suffered a large drop.
- Whether flexible spending could be reduced temporarily after a poor market year.
- Whether the portfolio's allocation into stock, bond, and cash is appropriate for the withdrawal time horizon.
- Whether readily available assets are sufficient for planned near-term withdrawals and unexpected costs.
- Whether retirement timing, part-time income, or contribution changes provide additional planning room.
FINRA notes that retirement portfolios can fluctuate and that retirees may need to monitor and adjust withdrawals. It also discusses asset allocation and diversification as ways to manage, rather than eliminate, investment risk.
Build an allocation around your withdrawal needs
Current Investor.gov guidance says the appropriate allocation depends largely on time horizon and risk tolerance, and that no single model is right for every goal. An older Investor.gov educational example describes a retirement-income portfolio with 30% to 50% in stocks and 50% to 70% in bonds, but the page is no longer updated and labels those percentages as examples. Use that range as a discussion prompt, not as a recommended mix for every retiree.
The current calculator does not model return sequences
The calculator applies one steady annual return during saving years and one steady annual return during retirement. If you enter a 5% retirement return, every modeled retirement year receives that same rate. It does not generate positive and negative market years, randomize their order, or estimate the probability of success.
This deterministic design keeps each result explainable and makes one-variable comparisons easy to audit. It is useful for asking how a plan changes under a lower assumed return, but it can make a long retirement path appear smoother than actual markets.
Do not read the projection as a forecast
A smooth line is the result of the entered assumptions, not a claim that investments will earn the same return every year. Modeling sequence risk requires variable annual returns and usually many possible paths.
See the model assumptions and important limitations before interpreting a calculator result.
What the calculator can still help you stress-test
A steady-return calculator cannot recreate sequence risk, but it can show whether the plan has room under more conservative assumptions. Keep the limitation visible and compare several deterministic cases:

| Test | Change one input | Question it helps answer |
|---|---|---|
| Lower-return case | Reduce the retirement return assumption | Does the plan rely heavily on continued growth? |
| Higher-spending case | Increase annual retirement spending | How sensitive is longevity to larger withdrawals? |
| Later-retirement case | Increase the planned retirement age | How does more saving time and fewer withdrawal years change the estimate? |
| Reduced-withdrawal case | Lower annual retirement spending | How much does spending flexibility extend coverage? |
These cases test the plan's sensitivity, not the chance that a particular return sequence will occur. A stochastic or historical simulation is a different tool with its own assumptions and limitations.
Use the retirement return assumptions guide to choose and document the base and lower steady rates used in these tests. Lowering a steady rate can show limited planning room, but it does not recreate the timing of gains and losses.
How to use the calculator with this limitation in mind
- Run a baseline savings-longevity estimate and record the ending age and balance path.
- Lower only the retirement return assumption and compare the years covered.
- Restore the return, then test a higher spending case to isolate withdrawal sensitivity.
- Test a lower spending case to estimate how flexibility changes the result.
- Treat all cases as smooth planning scenarios and seek a variable-return analysis if return order is material to the decision.
Record a range, not one promised outcome
A baseline and conservative case communicate the uncertainty better than one precise depletion age produced from a steady return assumption.
Frequently asked questions
What is investment returns risk during retirement?
Investment returns can vary from year to year. The timing effect described in this guide is commonly called sequence-of-returns risk: early retirement losses can be especially damaging because withdrawals leave less money available for a recovery.
Does the average return capture sequence risk?
No. Two portfolios can experience the same set of returns and the same average return but finish with different balances when withdrawals occur in different years.
Does this retirement calculator model sequence risk?
No. The calculator applies one steady annual return before retirement and another steady annual return during retirement. It is useful for deterministic scenario comparisons but does not simulate yearly market volatility or return order.
When does sequence risk matter most?
It is particularly relevant near and during the early retirement years, when a portfolio may face both market losses and ongoing withdrawals with less employment income available to replace the money.
How can I stress-test sequence risk with this calculator?
You cannot reproduce a return sequence directly, but you can compare lower retirement-return assumptions, higher spending, delayed retirement, or reduced withdrawals. These are conservative deterministic tests, not substitutes for a variable-return simulation.
Is a lower retirement return assumption the same as modeling sequence risk?
No. A lower steady return is a conservative sensitivity test, but it still applies the same rate every year. Sequence-risk modeling varies annual returns and their order while withdrawals occur.
Sources and important limits
These official investor-education resources explain investment risk, market losses near retirement, portfolio management, and withdrawals. The worked sequence is an original mathematical illustration and does not use or predict market data.
Reference links
This calculator provides educational estimates only and is not financial, tax, legal, or investment advice.